Yop, TDD stats
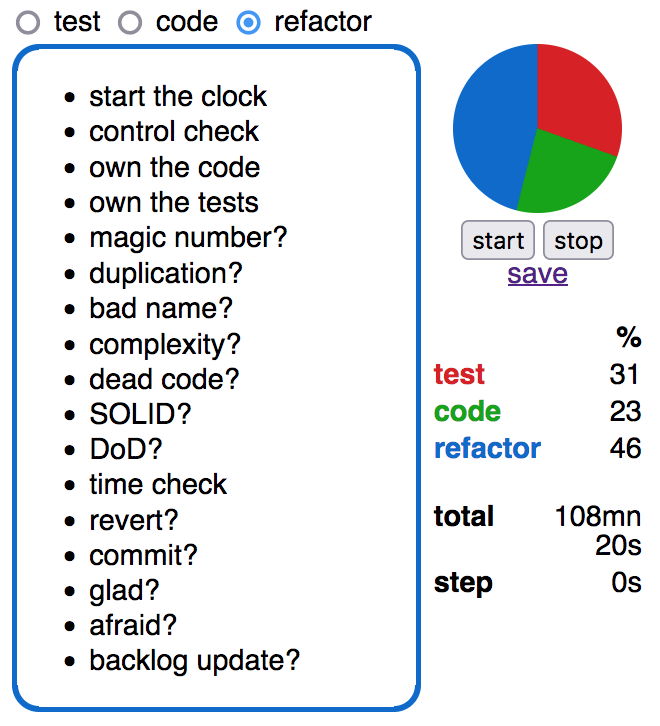
Synchronicity again! I wanted to explore the conic-gradient way of displaying a pie chart, share a TDD checklist, and finally build that tool to track how long I spend on each step of the cycle.
And I wanted to use Github pages as the deployed environment to keep things simple.
Here it is!
If you don’t like the check lists, fork, modify and enjoy!